The Scopes Panel allows you to monitor the color values of the output of your project, based on the combined layers visible on the timeline at the playhead’s current position.
Scopes can help you accurately set exposure and balance, and help ensure consistency between shots.
Histogram, RGB Parade, Vectorscope, and the Waveform monitor are the four types of scopes that are available in FilmoraPro.
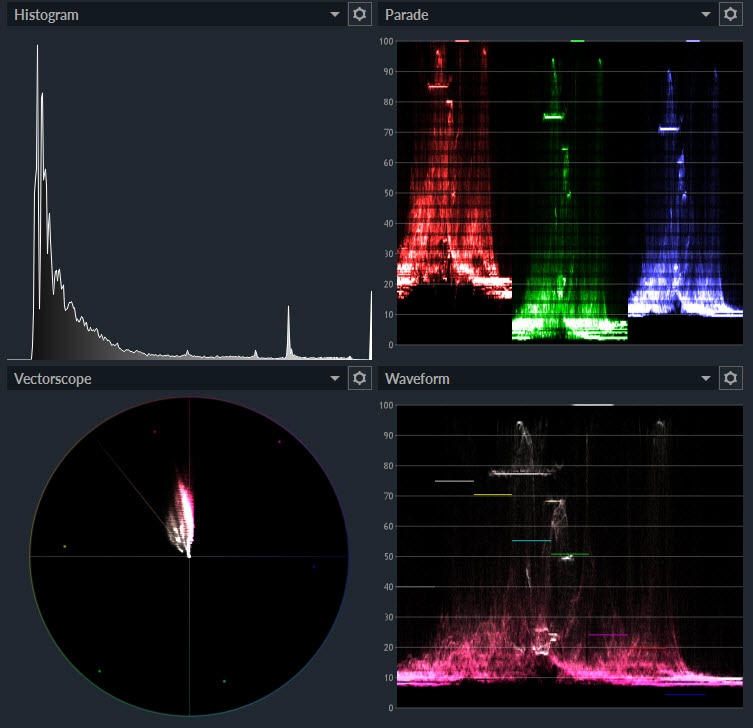
The Scopes Panel
The layout of the Scopes Panel can be rearranged using the icons in the upper right corner of the panel. You can choose a combination of two, three, or four scopes or to display a single scope.

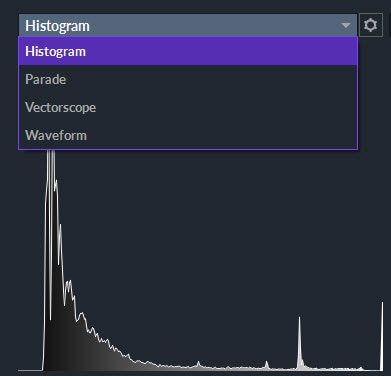
The names of the scopes are shown above them. You can change which scope is displayed by clicking on its name and selecting one of the other scope options from the dropdown menu. The same scope can be selected more than once, so you can have two Histogram or RGB Parade scopes displayed at the same time.
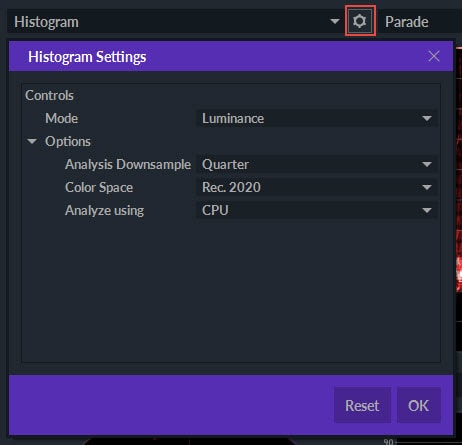
Next to the dropdown menu that lets you select which type of scope is displayed, you'll see a cog icon. Use this to adjust the scope's properties. Each of the four scopes has different properties that affect how the color values are displayed within the Scopes Panel.
The Four Types of Scopes
FilmoraPro contains four types of scopes that let you evaluate your projects from multiple perspectives. Each scope has a unique set of properties that let you control the type of information being displayed. The cog icons located at the top of each scope allow you to adjust their properties and select the type of data a scope will monitor.
Histogram
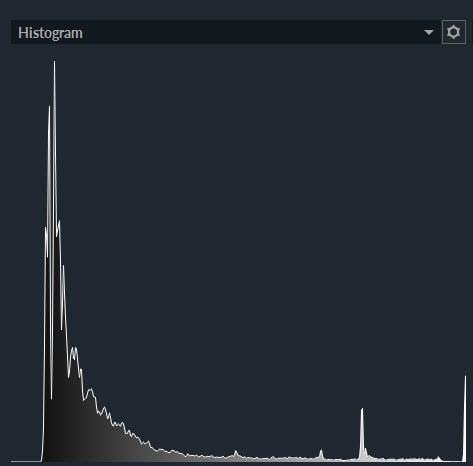
The color tones are displayed in the Histogram scope. The tones range from pure black on the left to the pure white on the right, while the height of the graph represents the relative frequency of a color tone in the video clip.
The Histogram Scope contains the following properties:
-
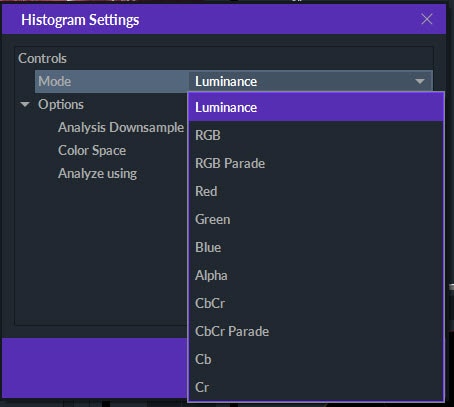
Mode: Choose the color information that is displayed in the Histogram. The different modes are:
-
Luminance – Depicts the luminance levels of the entire image in a grayscale graph.
-
RGB – Displays the Red, Green, and Blue channels concurrently as colored overlays.
-
RGB Parade – Shows the Red, Green, and Blue channels separately in a vertical stack.
-
Red - Shows the values of the Red channel only.
-
Green - Shows the values of the Green channel only.
-
Blue – Shows the values of the Blue channel only.
-
Alpha – Displays levels of the alpha channel.
-
CbCr - Depicts the blue and red chroma difference channels of the YCbCr color space. The Y value represents luminance that can be selected separately.
-
CbCr Parade – Depicts the blue and red chroma difference channels of YCbCr color space as individual readouts in a vertical stack.
-
Cb- Only displays the blue chroma difference channel.
-
Cr- Only displays the red chroma difference channel.
-
Analysis Downsample – This option is for increasing or decreasing the precision of the readout. The lower sample rates improve speed while compromising accuracy. The higher sample rates are slower but offer more accurate readouts.
-
Color Space - You can choose between three color space options:
-
REC.601 – Used for standard definition (SD) footage.
-
REC.709 – Used for high definition (HD) footage.
-
REC.2020 – Used for ultra-high definition (UHD) footage.
-
Analyze Using – Lets you analyze the footage with your GPU or CPU.
Parade
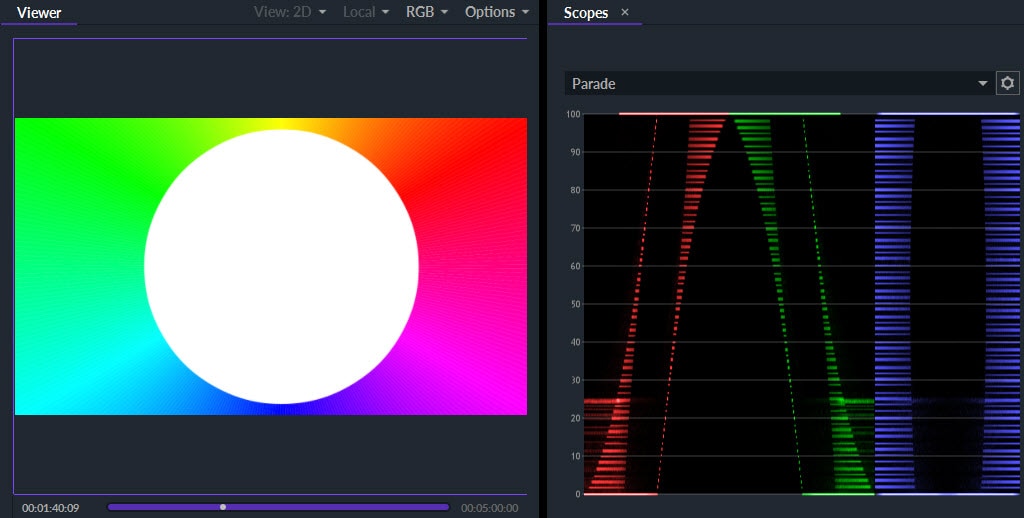
The Parade scope displays a readout of the contents of the color channels an image contains. Each channel readout is displayed individually, one after another, as in a “parade.”
The left to right axis of each channel graph in the parade represents the pixels of the image from the left edge to the right. Therefore, the colors on the left side of the image will be depicted on the left side of the graph, and their intensity will be measured by the height of the graph on the vertical axis.
In the image above you can see that green is on the left side and, as a result, the spike of green values appears on the left side of the graph. Red is dominant on the right side of the image and the red color peak is clearly visible on the right side of the graph.
The Parade Scope features the following options:
-
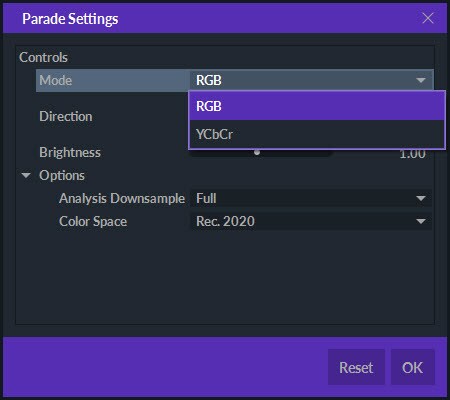
Mode – Choose the color information that is displayed in the Scope
-
RGB - Displays the Red, Green, and Blue channels concurrently as colored overlays.
-
YCbCr – Displays the Y (Luminance), as well as the blue (Cb) and red (Cr) chroma difference channels in the YCbCr color space.
-
Direction – Colors on the vertical axis are displayed from left to right by default, but you can change that using the rotation wheel to set the direction to 90-degrees. This will alter the way an image is mapped so the colors on the left side are displayed at the top of the scope while those on the right will be located near the bottom of the scope.
-
Brightness – Control how dark or bright the graph in the scope is. Increasing the brightness may help you read the graph faster. The brightness adjustments you make in the Parade scope have no impact on your footage.
-
Analysis Downsample – Increase or decrease the accuracy of the readout. Lower sample rates offer less accuracy and more speed.
-
Color Space - Choose between three color space options:
-
REC.601 – Used for standard definition (SD) footage.
-
REC.709 – Used for high definition (HD) footage.
-
REC.2020 – Used for ultra-high definition (UHD) footage.
Vectorscope
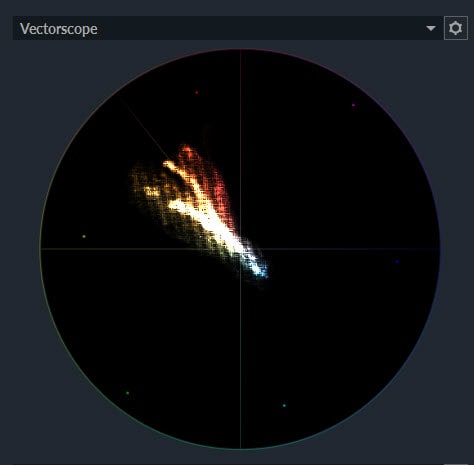
The Vectorscope enables you to monitor the hue and saturation values of the image. The scope shows the hue and saturation values for the playhead’s current position on the timeline, and you can keep track of how these values change from clip to clip by hitting the play button. Hue is depicted around the circle, while saturation is displayed along the radius. If a color is highly saturated it will be displayed closer to the circle’s outer rim, and if it is less saturated it will be displayed close to the center of the circle.
The Vectorscope features six color points that are placed around the circle’s perimeter. They represent the color of standard video color bars.
There is a diagonal line in this scope called the Skin Line which helps find the skin tones in your video.
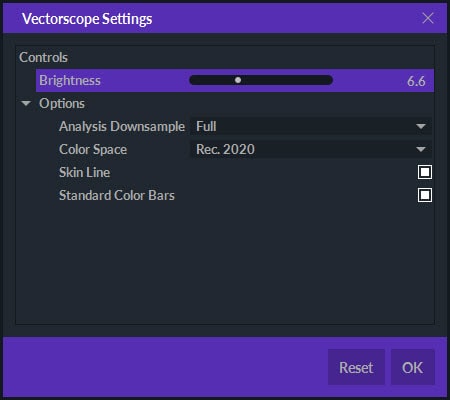
The Vectorscope contains the following options:
-
Brightness – Control how dark or bright the graph in the scope is. Increasing the brightness may help you read the graph faster. The brightness adjustments you make in the Vectorscope have no impact on your footage.
-
Analysis Downsample – Increase or decrease the accuracy of the readout. Lower sample rates offer less accuracy and more speed.
-
Color Space - Choose between three color space options:
-
601 – Used for standard definition (SD) footage.
-
709 – Used for high definition (HD) footage.
-
2020 – Used for ultra-high definition (UHD) footage.
-
Skin Line – Toggle the skin line on and off.
-
Standard Color Bars – Toggle the color bar indicators on and off.
Waveform
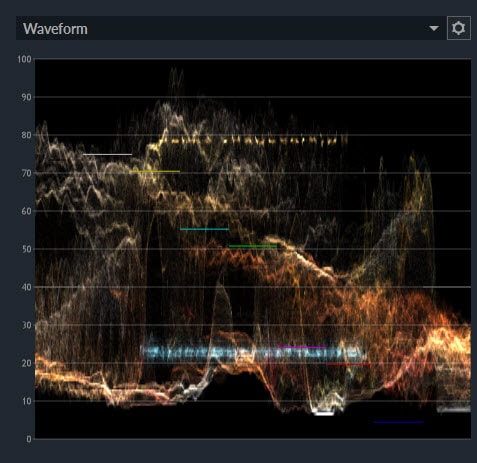
All contents of the current frame are displayed in the Waveform scope. The colors are displayed on the horizontal axis from left to right – the colors on the left side of a frame are on the left side of the graph. The vertical axis shows the intensity of a color channel in a frame.
The Waveform Scope contains the following properties:
-
Mode – Choose the color data that is displayed in the scope.
-
RGB - Displays the Red, Green, and Blue channels concurrently as colored overlays.
-
YCbCr – Displays the Y (Luminance), as well as the blue (Cb), and red (Cr) chroma difference channels in the YCbCr color space.
-
Direction – Colors on the vertical axis are displayed from left to right by default, but you can change that using the rotation wheel to set the direction to 90-degrees. This will alter the way an image is mapped so the colors on the left side are displayed at the top of the scope while those on the right will be located near the bottom of the scope.
-
Brightness – Control how dark or bright the graph in the scope is. Increasing the brightness may help you read the graph faster. The brightness adjustments you make in the Vectorscope have no impact on your footage.
-
Analysis Downsample – Increase or decrease the accuracy of the readout. Lower sample rates offer less accuracy and more speed.
-
Color Space - Users can choose between three color space options:
-
601 – Used for standard definition (SD) footage.
-
709 – Used for high definition (HD) footage.
-
2020 – Used for ultra-high definition (UHD) footage.